


11.3.1 Ratio of land consumption rate to population growth rate
Data refer to 2020 in relation to 2015 (unless otherwise indicated).
Interpretation
The indicator shows how quickly land consumption rate in the city (resulting from its development) changes in relation to change of its population growth rate, where:
• Land consumption rate is the average annual rate at which the urbanized land in the city changes in a given period (compared to the beginning of the period under study); a positive value of the indicator means an increase in the area of built-up land in a given period, and a negative value - its decrease,
• Population growth rate is the average annual change in the city's population in a given period (compared to the beginning of this period); a positive value of the indicator means an increase in population in a given period, and a negative value - a decline.
Indicator 11.3.1 takes positive values when there is a simultaneous increase or decrease in both land consumption rate and population growth rate (and negative values when one of the components increased and the other decreased). If the value of the indicator is greater than 1, it means that built-up area in the city increased faster than its population increased in this period, which may suggest that urban land in the city is not used in sustainable manner.
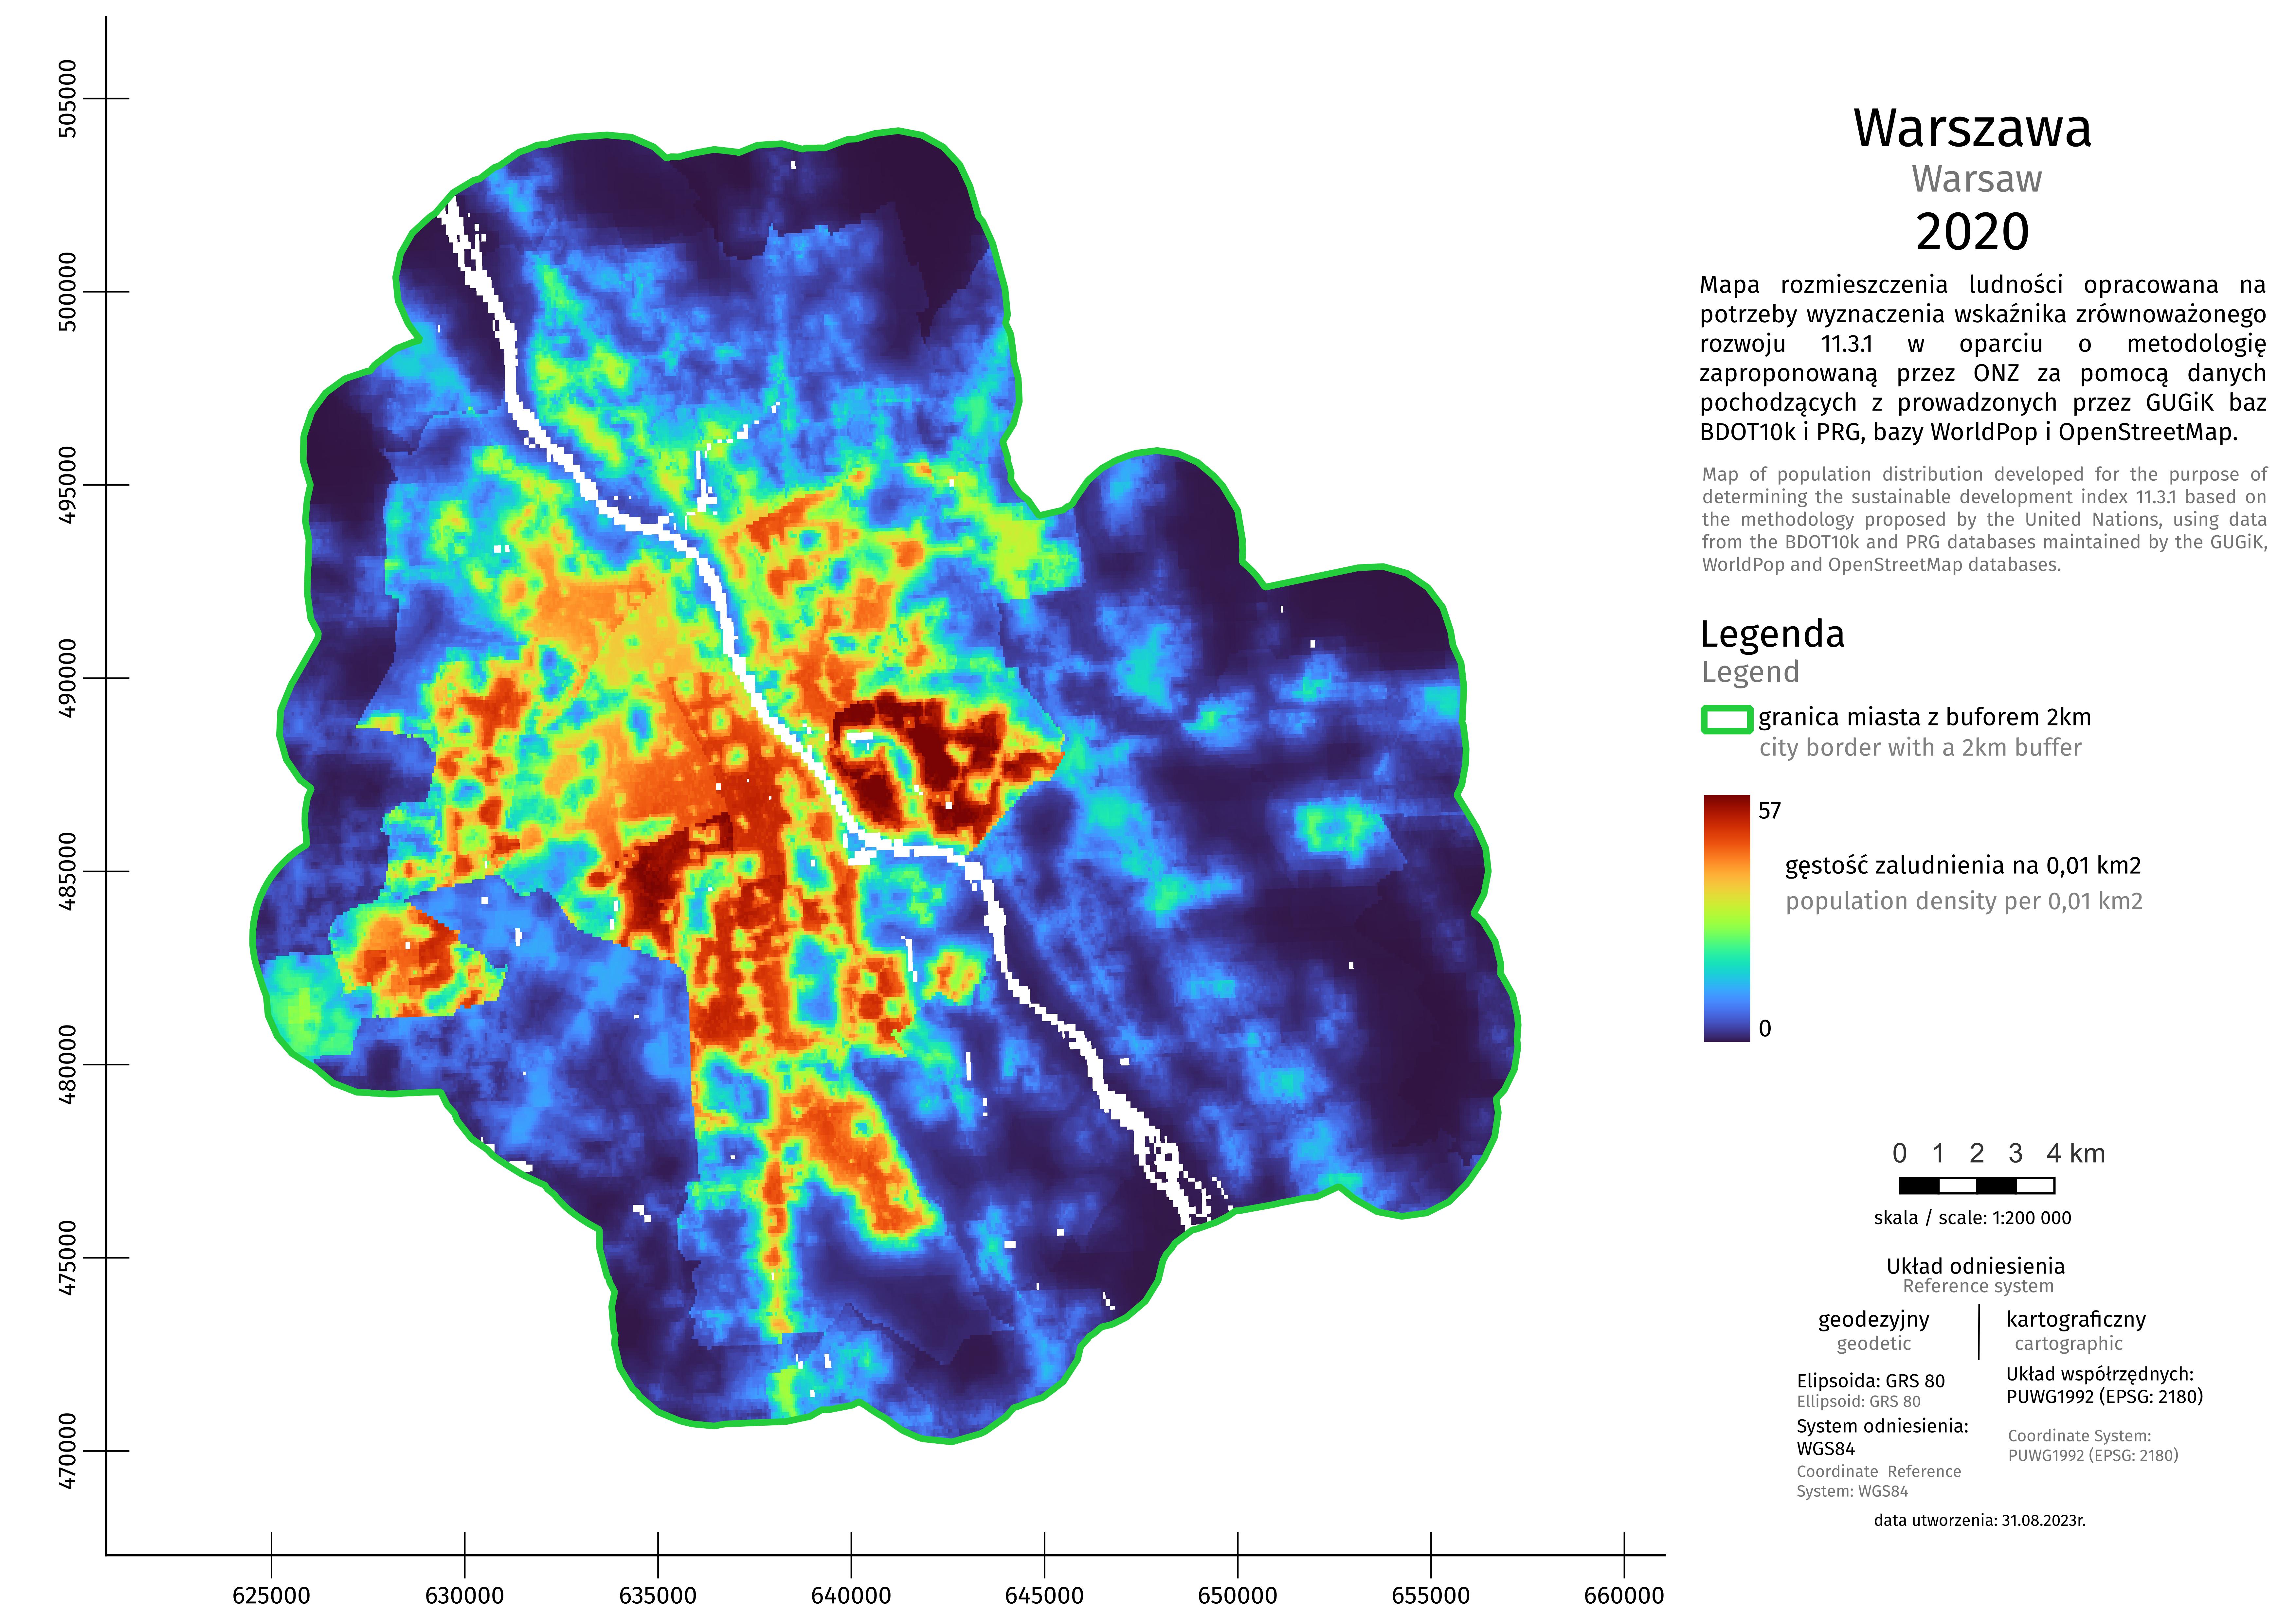
Here you can find a set of context indicators, the data for which come from official statistics of Statistics Poland. The purpose of context indicators is to complement the results of experimental SDG statistics, deepen information on the monitored phenomena and provide support in assessing progress in implementing sustainable development.
How did we calculate the indicator?
In order to calculate the indicator, the following stages were carried out:

1. The administrative boundaries of cities were determined from the National Register of Boundaries (PRG) database.
2. A buffer with a radius of 2 km from the city limits has been designated.
3. Cloudless mosaics of radar and optical data were developed and matched to the analyzed areas of cities and adjacent areas.
4. Radiometric indicators for satellite data were determined. On their basis, an object classification was carried out and maps of urbanized areas were developed, and their area was calculated for 2015 and 2020.
5. A script was developed to automate calculations in the Google Earth Engine environment.
6. The population in the analyzed area was calculated for the indicator for 2015 and 2020, as well as the final value of the 11.3.1 indicator was determined.
Detailed information on calculations based on the UN methodology can be found in the indicator metadata.
What sources were used to calculate the indicator?
The indicator was calculated based on the methodology proposed by the UN using data from three sources: Sentinel satellite data, National Register of Boundaries (PRG) database maintained by Head Office of Geodesy and Cartography of Poland (GUGiK) and the WorldPop database.

Sentinel satellite data - data from the European Earth observation programme Copernicus. The indicators were calculated using data from the Sentinel-1 (radar data) and Sentinel-2 (optical data) satellites. Data resolution is 10x10 meters.

National Register of Boundaries (PRG) is an official database providing basis for other spatial information systems. The PRG register collects data concerning area of the whole country, including: boundaries and areas of the units of the three-tier administrative division of Poland (i.e. voivodships, poviats, gminas).

Validation
Being prepared...

What is the meaning of the indicator for sustainable development?
Sustainable urban development requires effective management of urban land in relation to the number of urban population. If land use is disproportionate to the population size, it may cause negative socio-economic and environmental consequences. These include, among others, increase in the costs of implementing and maintaining technical and transport infrastructure, increasing inequalities in access to public services, as well as deterioration of spatial order and aesthetics of cities and a threat to biodiversity.

Applications for local government units
The indicator data provide information that can be used, e.g. in planning the development of cities (including spatial development) and suburban areas.