


11.2.1 Proportion of population that has convenient access to public transport
Data refer to 2020.
Interpretation
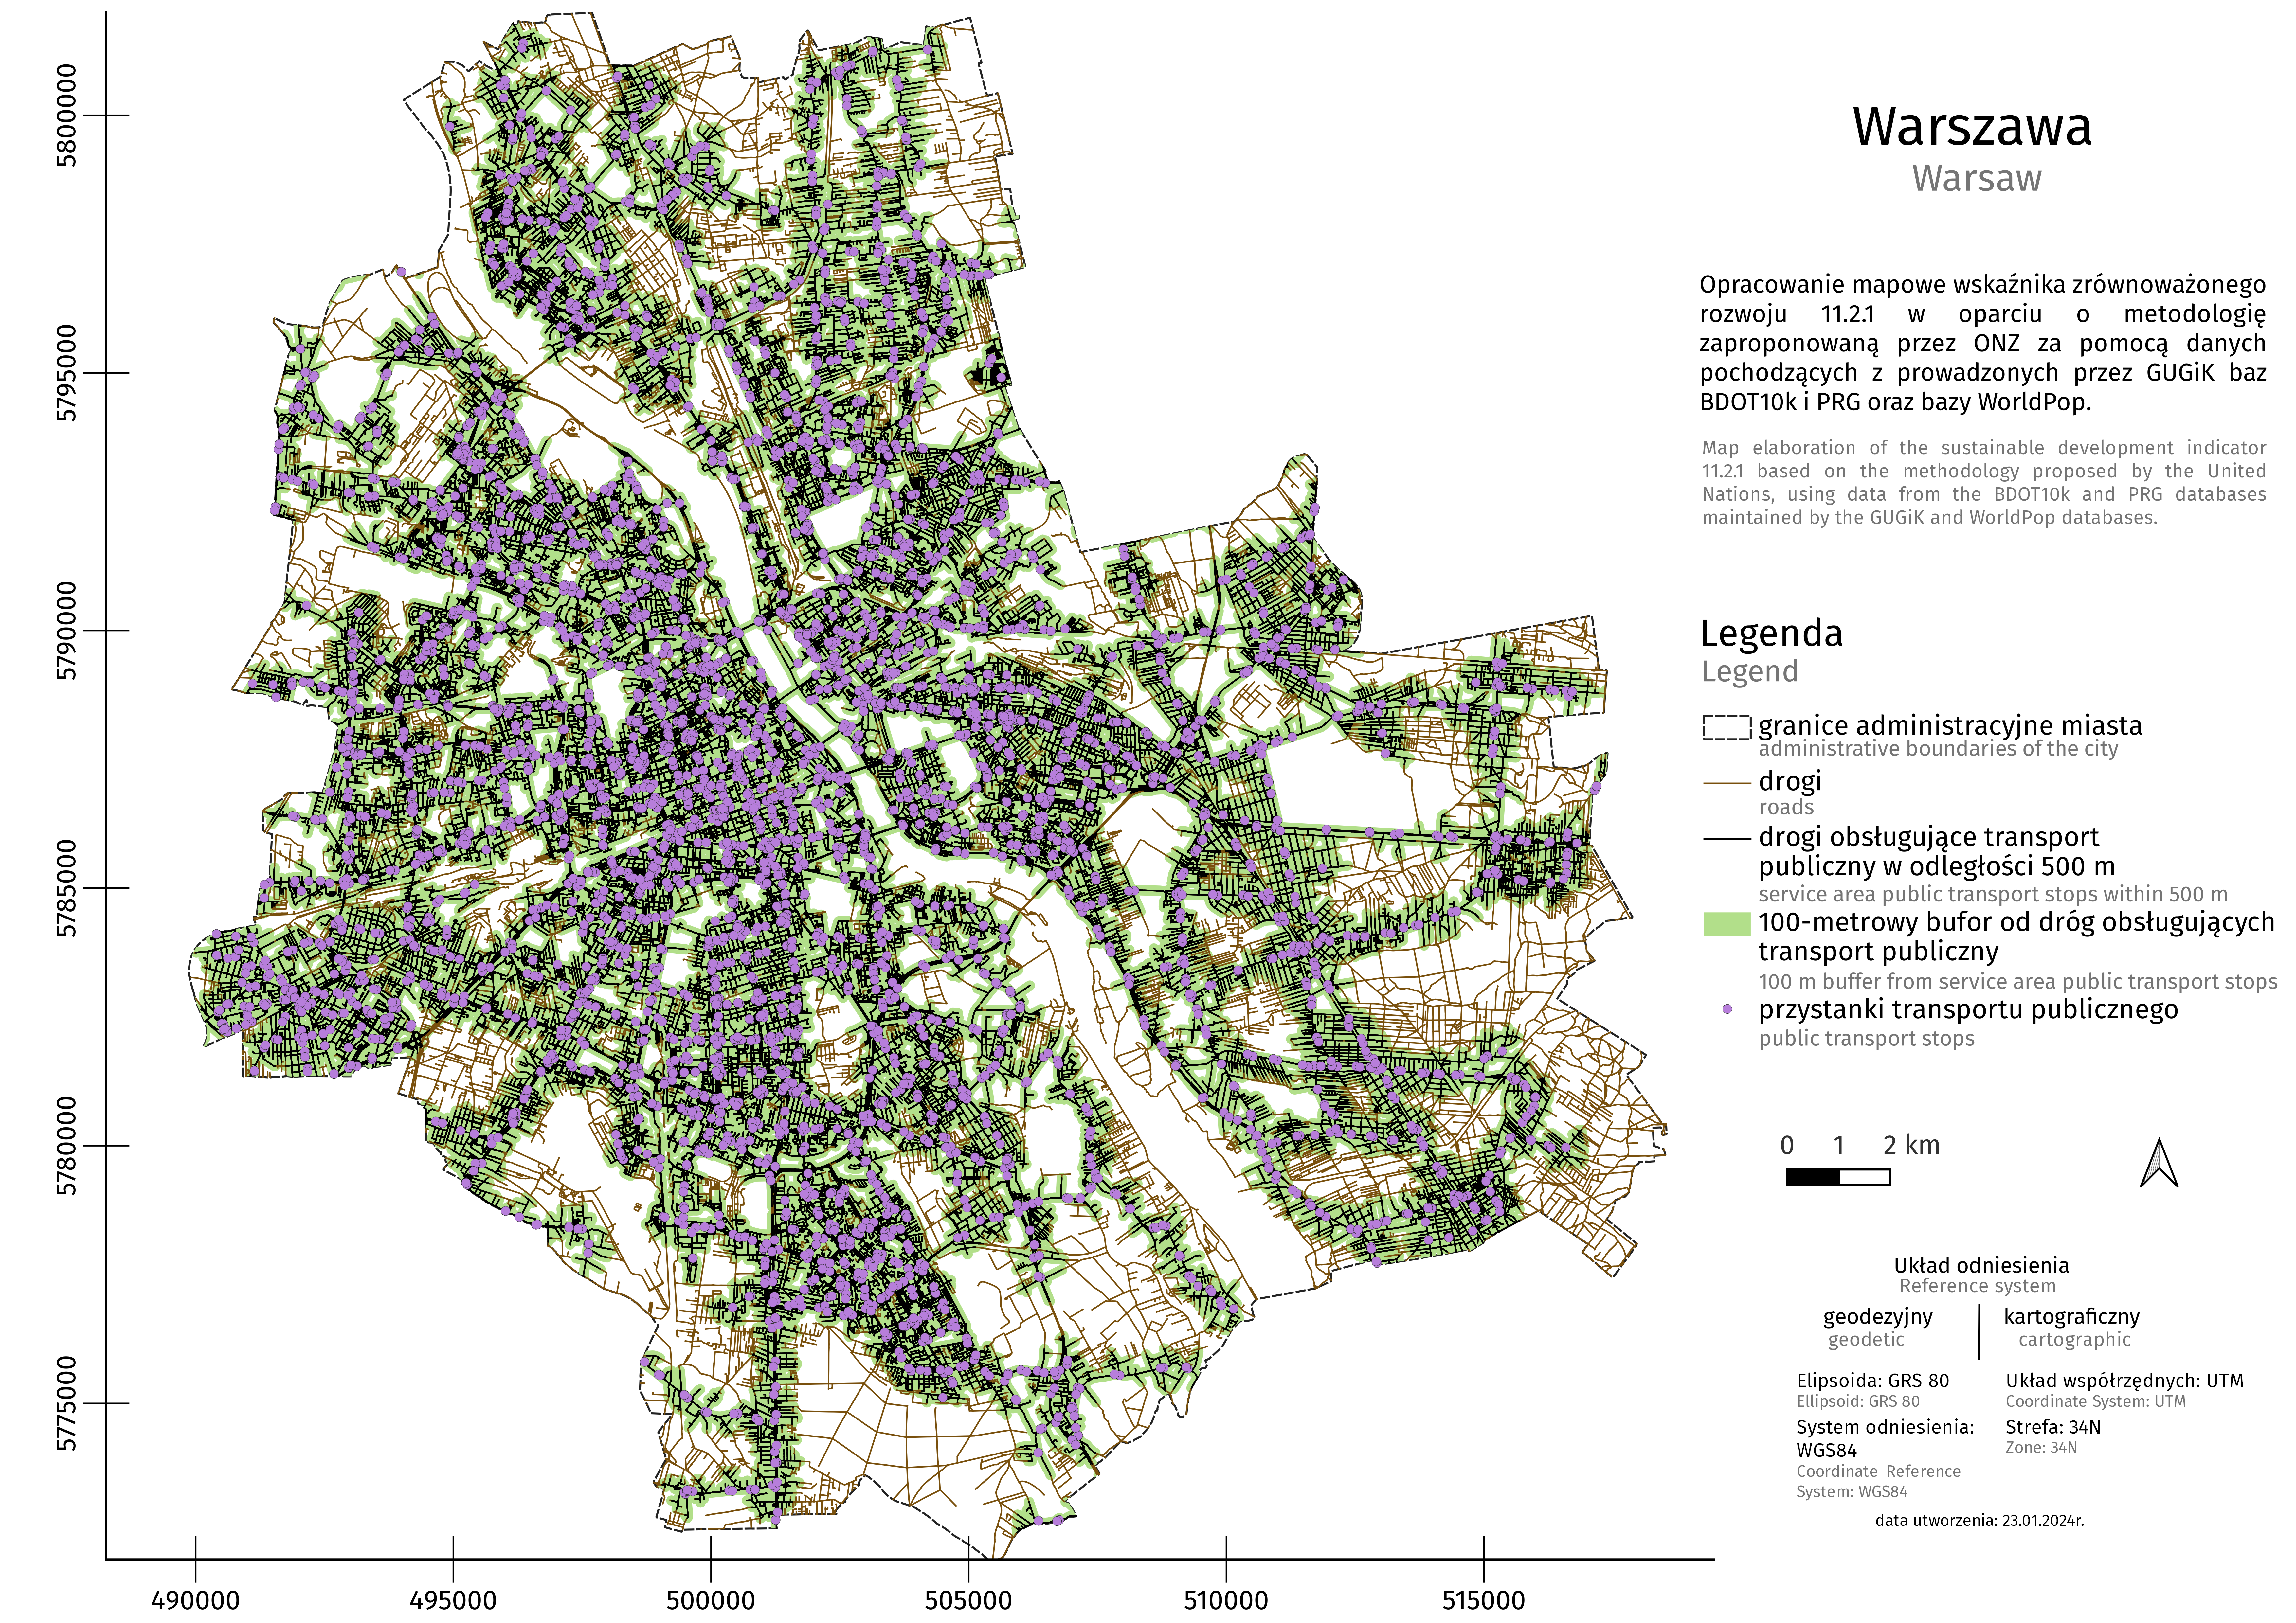
The indicator presents proportion of population with convenient access to public transport stops in 2020. The access to public transport is considered convenient when a stop is accessible within a walking distance along the street network of 500 m from a reference point.
Here you can find a set of context indicators, the data for which come from official statistics of Statistics Poland. The purpose of context indicators is to complement the results of experimental SDG statistics, deepen information on the monitored phenomena and provide support in assessing progress in implementing sustainable development.
per 10 km2 in 2023
How did we calculate the indicator?
In order to calculate the indicator, the following stages were carried out:

1. The administrative boundaries of cities were determined from the National Register of Boundaries (PRG) database.
2. Public transport stops in cities and street networks accessible for pedestrians were designated from BDOT10k database.
3. A spatial analysis was made of convenient (within 500 m walking distance) access to public transport in cities.
4. A 100-meter buffer has been designated for access routes to public transport stops.
5. The population with convenient access to public transport (within 500 m walking distance) was calculated (based on WorldPop). The proportion of population with access to public transport stops within 500 m was determined (Indicator 11.2.1).
Detailed information on calculations based on the UN methodology can be found in the indicator metadata.
What sources were used to calculate the indicator?
The indicator was calculated based on the methodology proposed by the UN using data from three sources: Sentinel satellite data, National Register of Boundaries (PRG) database maintained by Head Office of Geodesy and Cartography of Poland (GUGiK) and the WorldPop database.

Topographic Objects Database (BDOT10k) is a vector database containing the spatial location of topographic objects along with their basic descriptive characteristics, corresponding in detail to a traditional topographic map on a scale of 1:10000. The database contains information about the type and category of roads, the type of road surface, as well as transport-related facilities (bus or tram stops, metro).

National Register of Boundaries (PRG) is an official database providing basis for other spatial information systems. The PRG register collects data concerning area of the whole country, including: boundaries and areas of the units of the three-tier administrative division of Poland (i.e. voivodships, poviats, gminas).

Validation
Being prepared...

What is the meaning of the indicator for sustainable development?
Convenient access to public transport is important for reducing poverty, social inequalities and transport exclusion. It increases opportunities for employment, use of health care services, education services and other public goods. It also contributes to economic growth in a region by realizing the potential of human capital and creating conditions for the development of economic activity. Free and easy access to public transport also reduces traffic jams, shortens travelling time and lowers travelling costs. Properly planned public transport, especially based on environmentally friendly means of transport, contributes to reducing pollutant emissions, thereby improving the health and quality of life of residents.

Applications for local government units
Indicator data provides information that may be useful in creating transport policies, especially in developing the public transport system, i.e.: in planning infrastructure investments, organizing communication lines, determining stops and timetables, creating transport service standards.